
Network Diagnostics
Feature Overview
Network Diagnostics is a troubleshooting tool. When devices go offline, commands fail, livestreams are unavailable, media uploads fail, or controls lag, operations personnel can manually initiate network probes on a specified dock to quickly identify which network segment is disconnected or which port is blocked at the network layer.
- Manual initiation: Diagnostics are initiated manually only for troubleshooting, rather than as scheduled checks.
- Scenario-based probing: Select the scenario that matches the issue. The system runs only the relevant probes to identify the root cause faster.
- Dock-side execution: The dock executes the probes in the "dock → platform" direction and reports the results to the platform for centralized display.
Prerequisites
Before starting diagnostics, confirm the following conditions. If any condition is not met, the system displays the corresponding reason and stops:
| Prerequisite | Description |
|---|---|
| Organization created | Create an organization in the AIO Admin Console first. Otherwise, diagnostics cannot be started. |
| Device online | Probe commands are sent to the dock via MQTT and cannot be initiated when the device is offline. |
| Supported model | Some models do not currently support Network Diagnostics. The corresponding action is unavailable in the device list. |
| Firmware version meets requirements | Diagnostics cannot run if the device firmware is below the required version. Update the firmware first. The "Firmware Version" column in the device list shows the current version. |
| No diagnostics in progress | Only one diagnostic task can run on the same device at a time. Wait for the current task to finish. |
Running Diagnostics
1. Select a Device
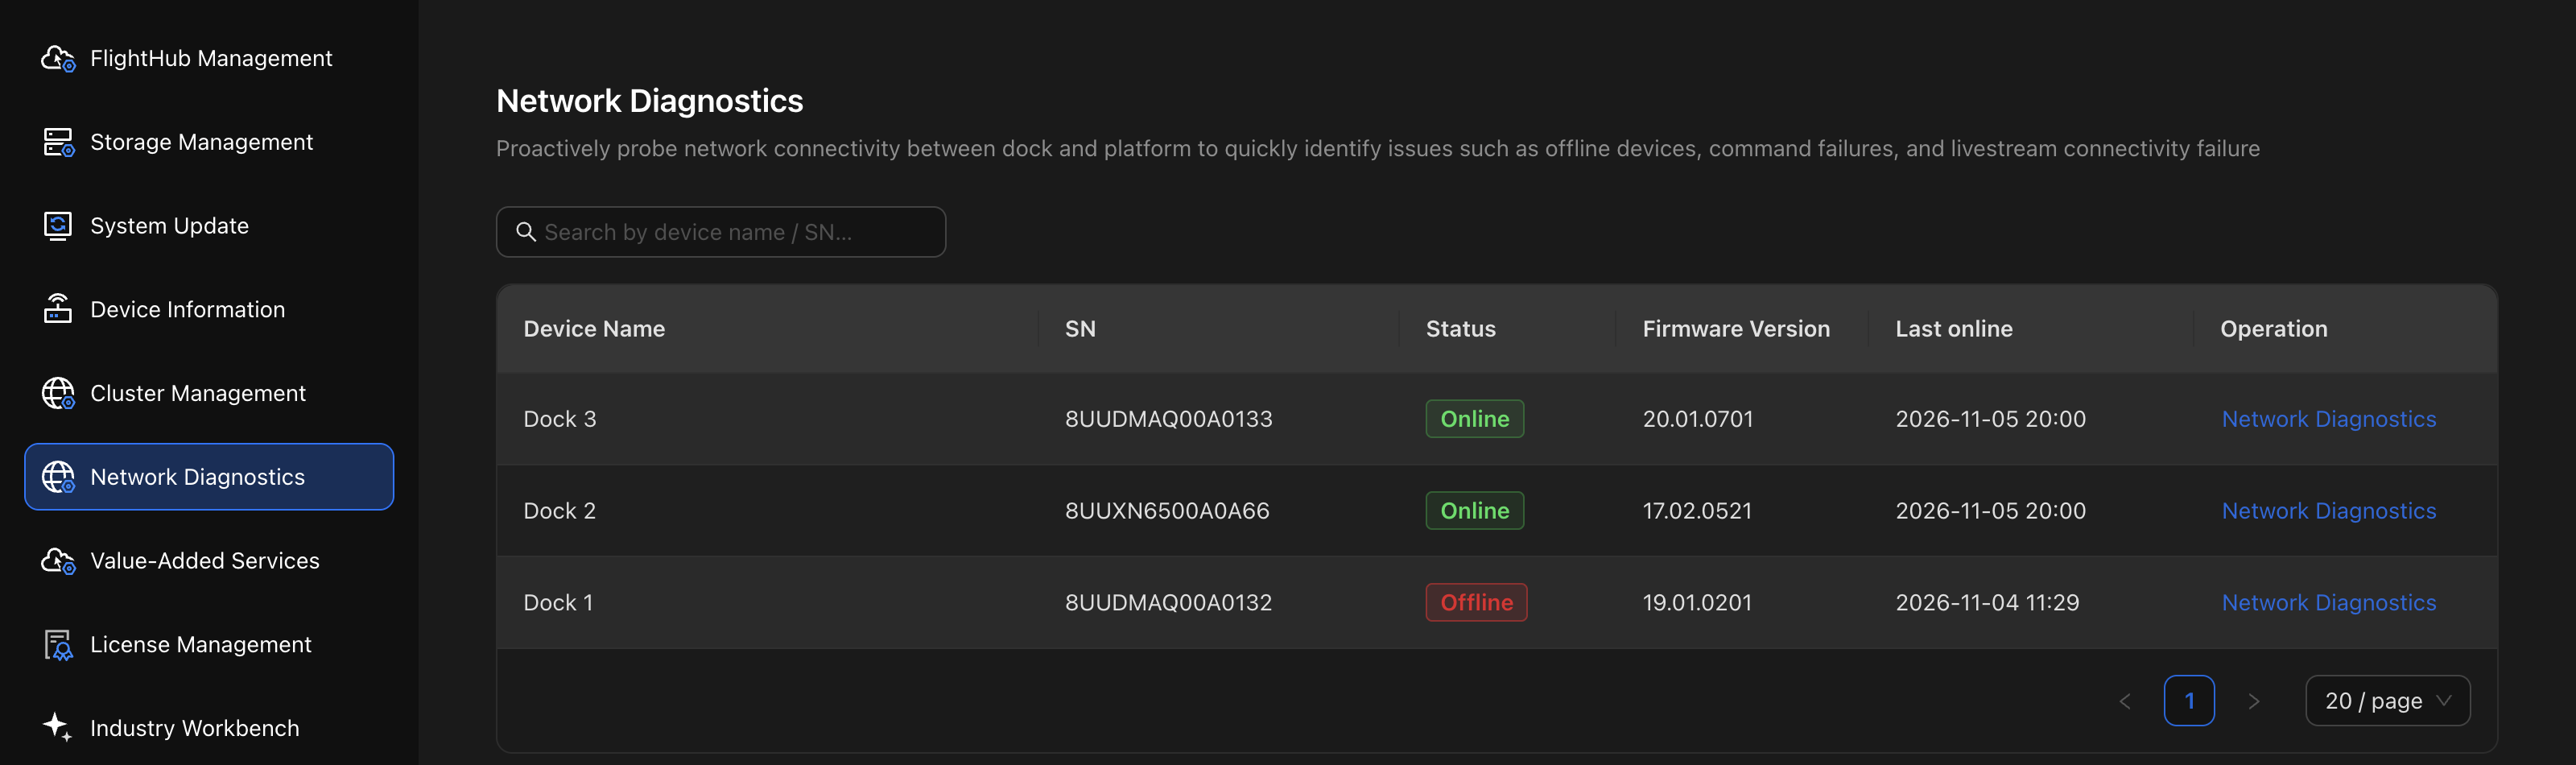
Log in to the AIO Admin Console (see Accessing the AIO Admin Console) and open "Network Diagnostics" in the left navigation panel. The device list displays each dock's name, SN, status, firmware version, and last online time. You can search by device name or SN. Click "Network Diagnostics" in the row of the target device.
2. Select a Diagnostic Scenario
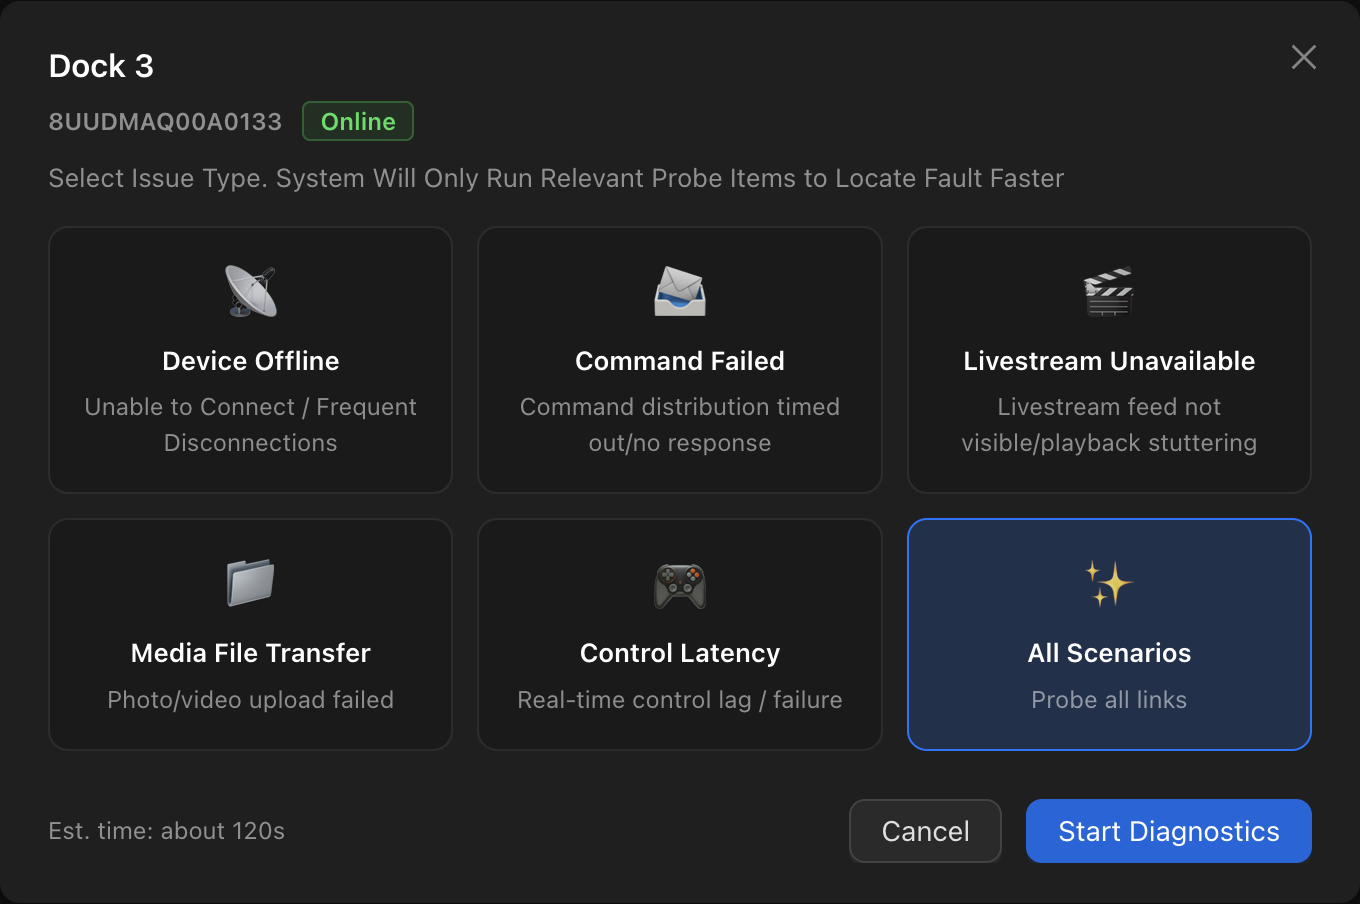
Select the scenario that matches the issue. The estimated duration is displayed after selection. Then click "Start Diagnostics". "Start Diagnostics" is disabled until a scenario is selected.
| Scenario | Applicable Symptoms |
|---|---|
| Device Offline | Device cannot come online / frequently disconnects |
| Command Failed | Command delivery times out / no response |
| Livestream Unavailable | No livestream video / stuttering |
| Media File Transfer | Photo / video uploads fail |
| Control Latency | Real-time controls lag / do not work |
| All Scenarios | Complete probing of all links |
The system runs only the probes relevant to the selected scenario. For the probes and durations for each scenario, see "Probe Details" below.
3. View Probe Progress
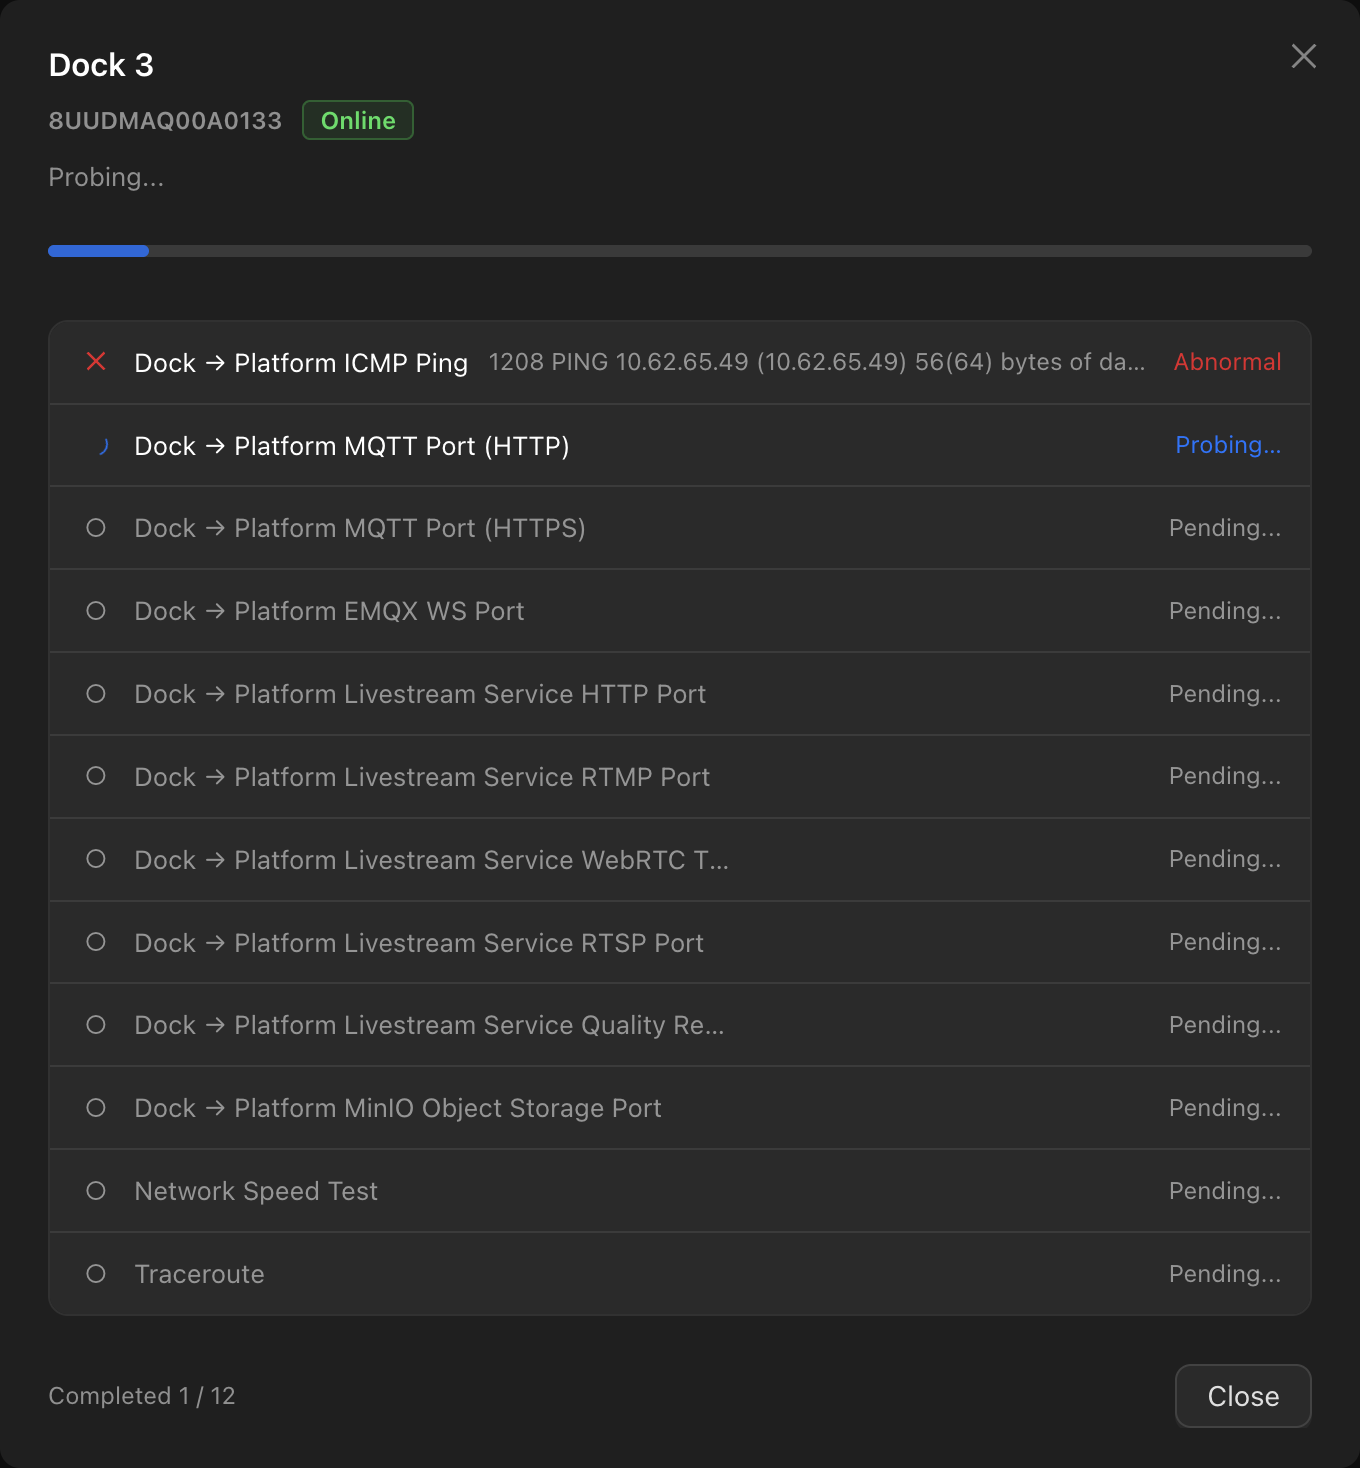
Once diagnostics start, the dialog displays overall progress ("Completed N / Total") and the status of each probe in real time.
Possible probe statuses:
| Status | Description |
|---|---|
| Pending | Probing has not started |
| Probing | The probe is running |
| Normal | The probe passed |
| Abnormal | The probe failed |
| Unknown Status | No probe result was received |
Note: If the page displays "Progress retrieval interrupted. Probing may still be running on the device", progress updates from the platform to the frontend have been interrupted, but probing may still be running on the device. Click "Retrieve Again" to restore the progress display.
Viewing Diagnostic Results
Once probing is complete, all results are displayed on the same page without navigating elsewhere.
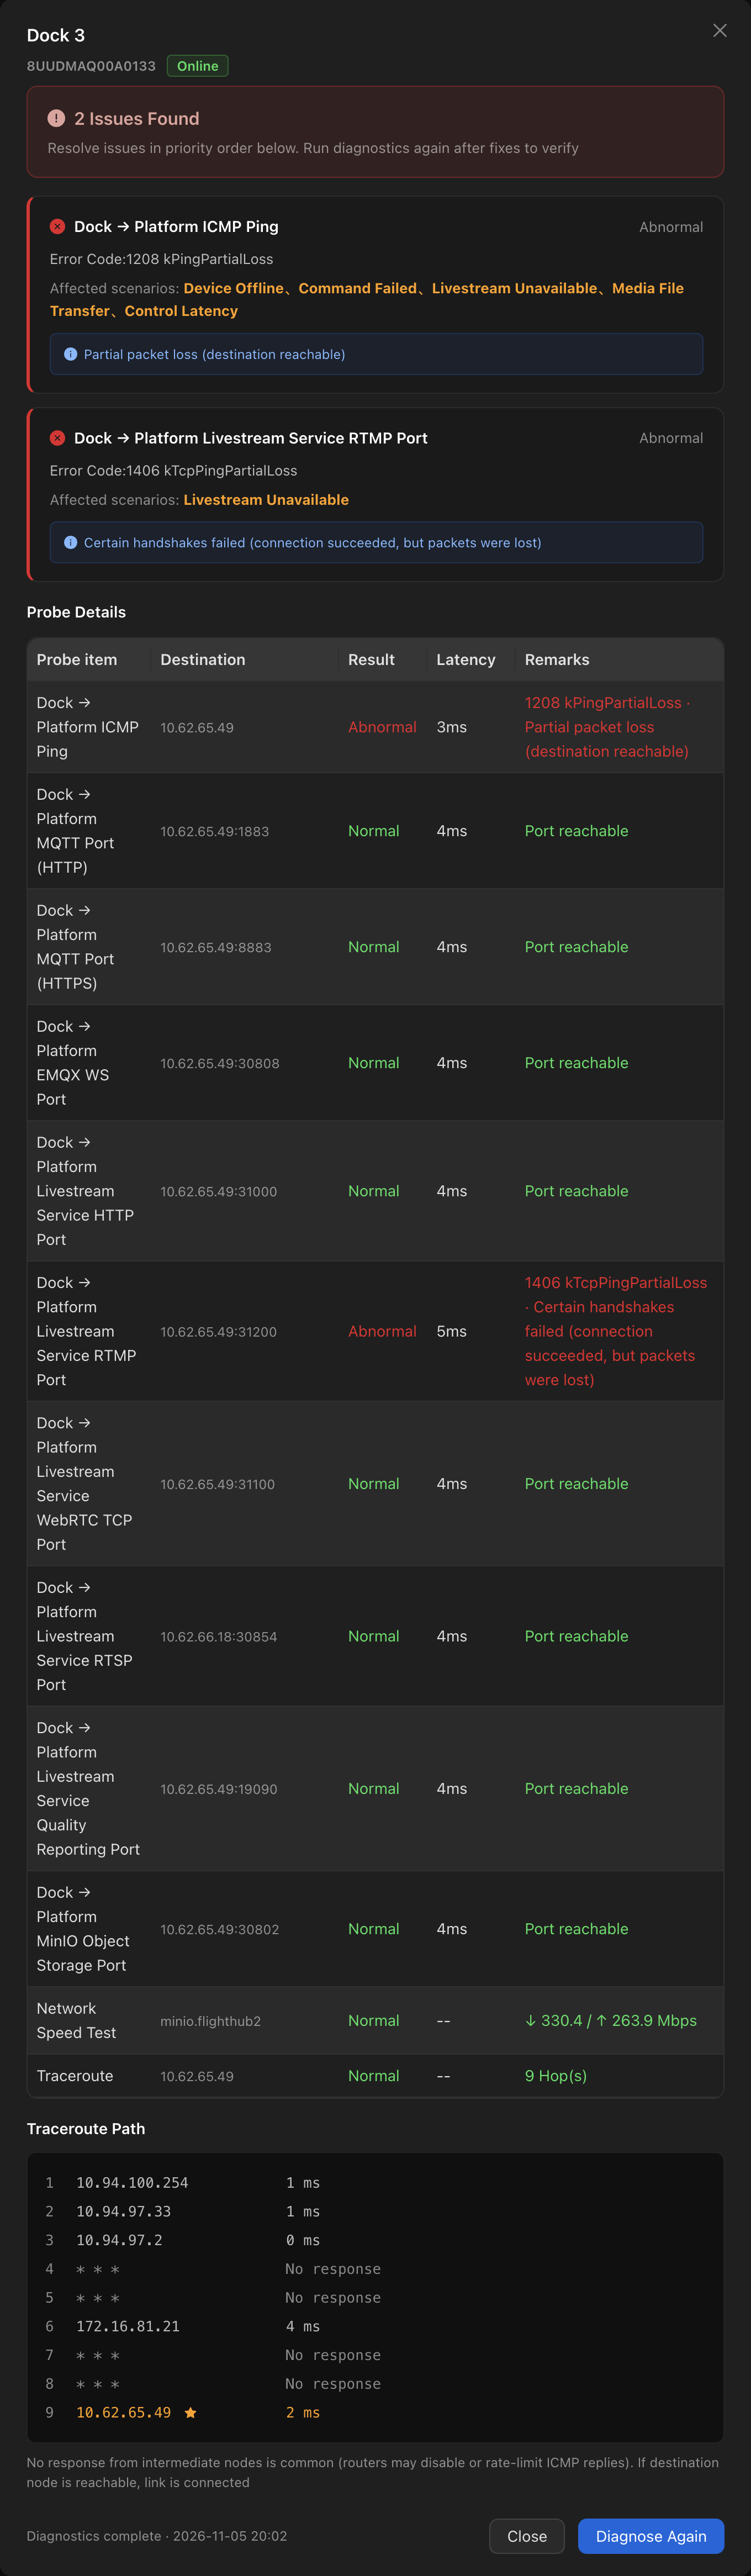
The results page contains the following sections, from top to bottom:
- Summary banner: Displays "N issues found" or "Network Diagnostics passed".
- Abnormal probe cards: Each card corresponds to an abnormal probe and displays its error code and the scenarios affected by the issue. One abnormal probe may affect multiple scenarios. For example, an abnormal ICMP Ping probe affects all scenarios. Some issues are caused by services that are not enabled. In these cases, no error code is displayed; the reason is shown directly (for example, "GB28181 is not enabled").
- Probe details: Lists the target, result, latency, and remarks for every probe. For normal probes, the remarks show probe data (such as "Port reachable" or "3ms / 0% packet loss"). For abnormal probes, the remarks show the error code and its meaning (such as
1208 kPingPartialLoss · Partial packet loss (reachable, but with packet loss)). - Traceroute path: Displays the hop-by-hop path from the dock to the platform. Hops that do not respond are displayed as
* * *, and the hop containing the destination node is specially marked.
After resolving the issues, click "Diagnose Again" to verify the fixes.
If diagnostics pass but services still have issues, the cause may be at the application layer (such as an expired certificate or authentication failure). Check the service logs for further troubleshooting.
Probe Details
Network Diagnostics includes 12 probes, all in the "dock → platform" direction. Selecting "All Scenarios" runs all probes. Selecting a specific scenario runs only the probes relevant to that scenario.
| Probe | What Is Tested | Related Services |
|---|---|---|
| Dock → Platform ICMP Ping | Basic connectivity, latency, and packet loss | Foundation for all services |
| Dock → Platform MQTT Port(HTTP) | Reachability of the unencrypted MQTT port | Device connection, command delivery |
| Dock → Platform MQTT Port(HTTPS) | Reachability of the encrypted MQTT port | Device connection, command delivery |
| Dock → Platform EMQX WS Port | Reachability of the device control WebSocket port | Real-time control |
| Dock → Platform Livestream Service HTTP Port | Reachability of the livestream signaling port | Livestreaming |
| Dock → Platform Livestream Service GB28181 SIP Port | Reachability of the GB28181 signaling port | Livestreaming (GB28181 access) |
| Dock → Platform Livestream Service RTMP Port | Reachability of the RTMP stream publishing port | Livestreaming |
| Dock → Platform Livestream Service RTSP Port | Reachability of the RTSP stream retrieval port | Livestreaming |
| Dock → Platform Livestream Service Quality Reporting Port | Reachability of the livestream quality reporting port | Livestream quality monitoring |
| Dock → Platform MinIO Object Storage Port | Reachability of the object storage port | Media File Transfer |
| Network Speed Test | Upload and download speeds | Livestreaming, Media File Transfer, control |
| Traceroute | Network path and per-hop latency from the dock to the platform | Locating issues along the link |
The probe targets are the platform address and the corresponding service ports. For the port list, see Network Requirements. If the default ports were changed during deployment, the probes use the ports actually configured.
The probes run for each scenario are listed below:
| Probe | Device Offline | Command Failed | Livestream Unavailable | Media File Transfer | Control Latency |
|---|---|---|---|---|---|
| Dock → Platform ICMP Ping | ● | ● | ● | ● | ● |
| Dock → Platform MQTT Port(HTTP) | ● | ● | — | — | — |
| Dock → Platform MQTT Port(HTTPS) | ● | ● | — | — | — |
| Dock → Platform EMQX WS Port | — | — | — | — | ● |
| Dock → Platform Livestream Service HTTP Port | — | — | ● | — | — |
| Dock → Platform Livestream Service GB28181 SIP Port | — | — | ● | — | — |
| Dock → Platform Livestream Service RTMP Port | — | — | ● | — | — |
| Dock → Platform Livestream Service RTSP Port | — | — | ● | — | — |
| Dock → Platform Livestream Service Quality Reporting Port | — | — | ● | — | — |
| Dock → Platform MinIO Object Storage Port | — | — | — | ● | — |
| Network Speed Test | — | — | ● | ● | ● |
| Traceroute | ● | ● | ● | — | — |
| Number of Probes | 4 | 4 | 8 | 3 | 3 |
"All Scenarios" runs all 12 probes. Estimated durations are approximately 30 seconds for Device Offline and Command Failed, approximately 90 seconds for Livestream Unavailable, Media File Transfer, and Control Latency, and approximately 120 seconds for All Scenarios.
Note: Scenarios that include Network Speed Test (Livestream Unavailable, Media File Transfer, Control Latency, and All Scenarios) take significantly longer and consume bandwidth. Run them during periods of low service activity.
When interpreting the results, note the following:
- An ICMP Ping failure does not necessarily mean the network is disconnected. Some network environments block only ICMP. In these cases, port probes can still pass and services are unaffected.
- A reachable port does not guarantee that higher-layer protocols are available. Port probes verify only whether a TCP connection can be established. They cannot detect application-layer issues such as expired certificates or authentication failures.
- It is normal for intermediate Traceroute hops to display
* * *. Most routers disable or rate-limit ICMP replies. If the destination node is reachable, the link is connected. - Network Speed Test consumes bandwidth. Run it during periods of low service activity.
Error Code Reference
When a probe fails, the abnormal probe cards and probe details on the results page display the error code and its meaning in the format "Error code Constant name · Meaning", for example, 1208 kPingPartialLoss · Partial packet loss (reachable, but with packet loss).
ICMP Ping Error Codes
| Error Code | Meaning Displayed | Recommended Actions |
|---|---|---|
| 1201 | socket creation failed | The dock-side probing program encountered an error. Click Diagnose Again; contact after-sales support if the issue persists |
| 1202 | Failed to send ICMP Echo | Check the dock's network interface status, then click Diagnose Again |
| 1203 | Failed to receive ICMP Echo Reply | Click Diagnose Again; contact after-sales support if the issue persists |
| 1204 | No replies received throughout the probe | The platform is unreachable or ICMP is blocked by a firewall. Check the port probe results: if port probes are normal, ICMP is usually blocked and services are unaffected |
| 1205 | Destination unreachable (ICMP Destination Unreachable received) | Check routing and gateway settings from the dock to the platform, and use the Traceroute path to locate the issue |
| 1206 | Invalid host (empty/incorrect format) | Check that the platform access address is configured correctly |
| 1207 | Domain name resolution failed | If a domain name is used to access the platform, check the dock-side DNS settings |
| 1208 | Partial packet loss (reachable, but with packet loss) | Link quality is unstable. Check for network congestion and check wireless or 4G signal quality |
Port Probe Error Codes
| Error Code | Meaning Displayed | Recommended Actions |
|---|---|---|
| 1401 | Invalid host (empty/incorrect format) | Check that the platform access address is configured correctly |
| 1402 | Domain name resolution failed | If a domain name is used to access the platform, check the dock-side DNS settings |
| 1403 | socket creation failed | The dock-side probing program encountered an error. Click Diagnose Again; contact after-sales support if the issue persists |
| 1404 | Connection failed (port rejected/unreachable) | The platform is reachable, but no service is listening on this port. The platform service is usually not running or the port is configured incorrectly. Contact platform operations personnel to check the service status |
| 1405 | Connection timed out (no SYN-ACK) | The connection request was dropped, usually by a firewall or security policy. Contact network operations personnel to allow traffic through the corresponding port |
| 1406 | Some handshakes failed (reachable, but with packet loss) | The link is unstable. Check for network congestion or packet loss |
| 1407 | Invalid port | Check that the port is configured correctly |
Distinguishing between 1404 and 1405 is key to locating port issues: 1404 indicates that the platform actively rejected the connection, so the issue is on the platform service side; 1405 indicates that the request received no response, so the issue is usually a firewall or security policy along the network link.
Messages When Diagnostics Cannot Be Started
If diagnostics cannot be started after clicking "Network Diagnostics", the page displays the specific reason:
| Message | Action |
|---|---|
| No organization has been created in DJI FlightHub 2. Create an organization in the AIO Admin Console first, then try again | Create an organization in the AIO Admin Console first |
| The device is offline. Network Diagnostics cannot run | Try again once the device is back online |
| This device model does not support Network Diagnostics | This model is not currently supported. No action is required |
| The device firmware version does not meet the Network Diagnostics requirements. Update to the specified version or later, then try again | Update the device firmware first |
| Diagnostics are in progress on this device. Wait for the current diagnostics to finish, then try again | Wait for the current diagnostics to finish |
| The Network Diagnostics service is not ready. Try again later | Try again later; contact after-sales support if the issue persists |
| Network Diagnostics failed to run. Try again later | Try again later; contact after-sales support if the issue persists |
| Environment error. Failed to retrieve the device list | Check the platform service status; contact after-sales support if the issue persists |
When the Device Is Offline
When the device is offline, the diagnostics dialog displays only an offline message and provides no option to start probing.
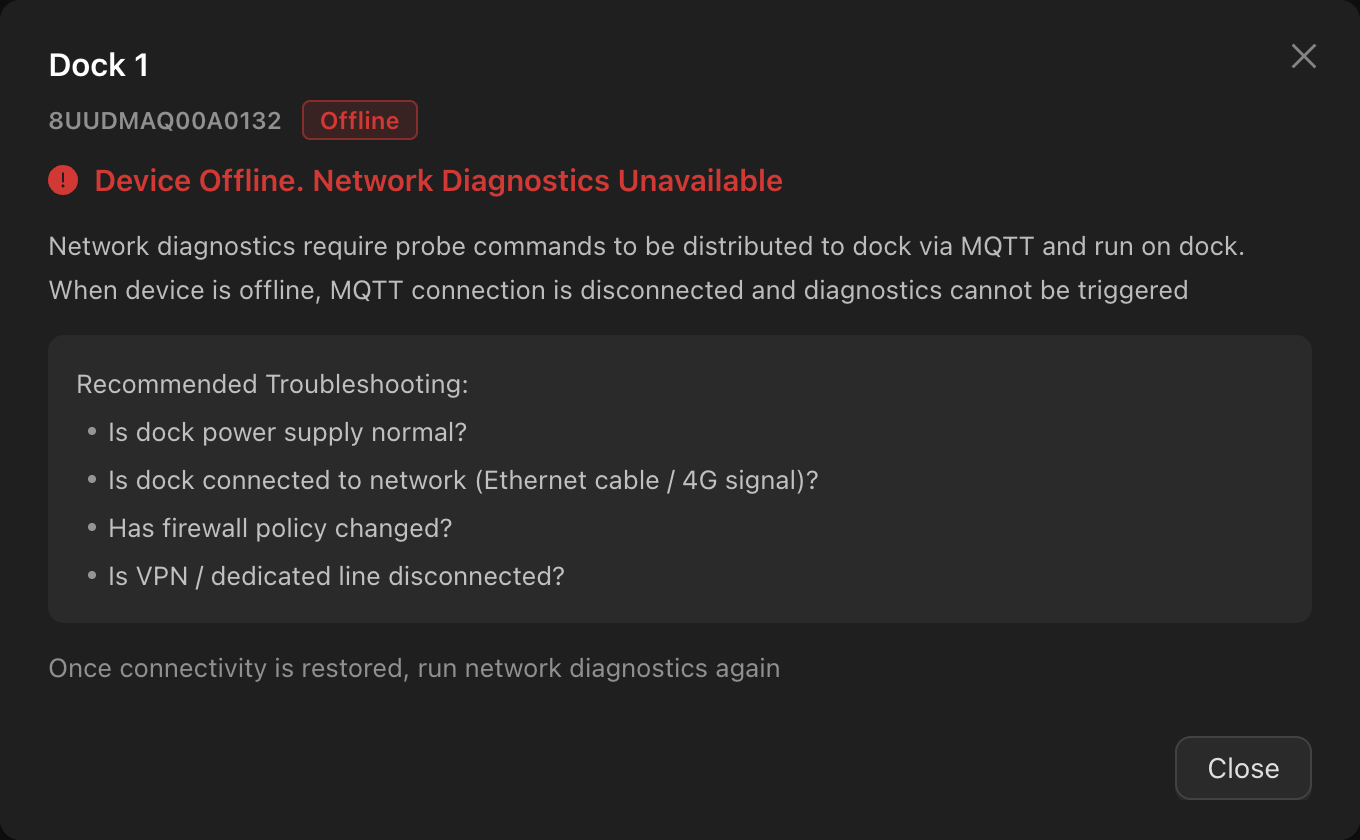
Check the following:
- Whether the dock's power supply is working properly.
- Whether the dock is connected to the network (Ethernet cable / 4G signal).
- Whether firewall policies have changed.
- Whether the VPN / dedicated line has been interrupted.
Once the device is back online, you can run Network Diagnostics again.
Usage Limitations
- Only the "dock → platform" direction is probed: Network segments from the platform to endpoints (such as browsers or remote controllers) are outside the probe scope.
- Only the network layer is covered: Port probes can confirm only port reachability. They cannot identify cases where a port is reachable but the protocol is unavailable (such as expired certificates or authentication failures). Use service logs to troubleshoot these issues.
- MTU probing is not supported: This feature cannot diagnose issues where ping succeeds but large file transfers fail in environments such as VPNs.
- Standalone DNS probing is not supported: If a domain name is used to access the platform, DNS issues appear as domain name resolution failure errors (1207, 1402).
- Network Speed Test consumes bandwidth: Running it during peak service activity may briefly affect ongoing livestreams or operations. Run it during periods of low service activity.